09 · Data science
Stock Anomaly
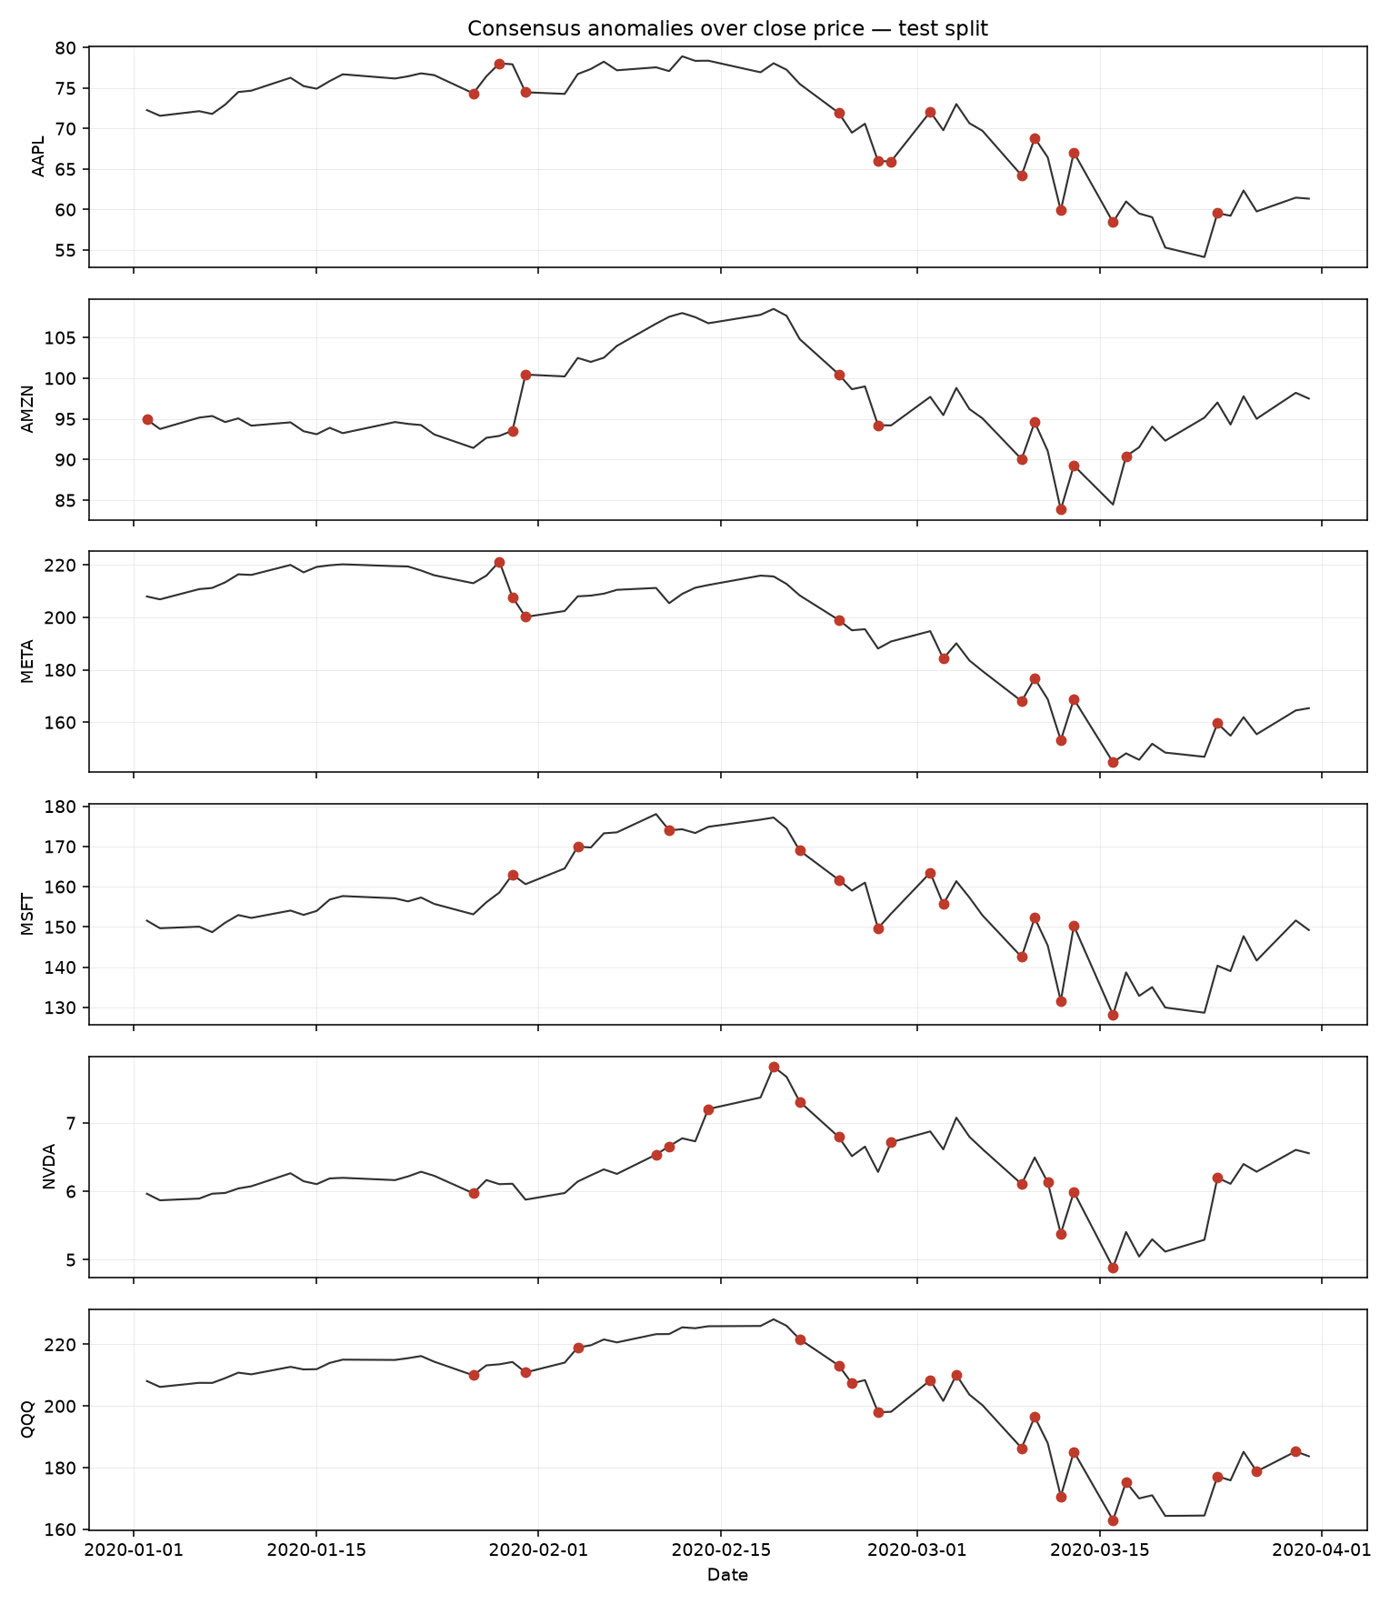
Unsupervised detection of unusual trading days, built so every feature and threshold is provably causal.
See it
The problem
Markets have no labelled anomalies, and almost every backtest quietly peeks at the future. A detector is only worth trusting if it provably cannot.
Numbers, with dates
- 10 of 12known S&P 500 stress sessions flagged by the consensus detector, at a 21% flag rate (the simple rule alone: 9 of 12 at 20%)reproduced 28 Oct 2026
- 9 of 9tests pass, including tests that rebuild features on truncated data and require identical resultspytest, 28 Oct 2026
How it works
- 01 · features
Causal features only
Every feature looks backwards, and a test proves it by truncating the data.
- 02 · fit
Fit on the past
Thresholds and clustering parameters are calibrated on earlier data to a fixed alarm budget.
- 03 · detect
Flag the unusual
Rule, k-means and DBSCAN each vote, and the consensus decides.
- 04 · score
Score against stress days
With no labels, twelve known stress sessions stand in, and the flag rate is shown beside recall.
What I built
- Four detectors over price and volume features: a transparent rule, k-means, DBSCAN, and a consensus of them.
- A causality test suite: features rebuilt on a truncated history must match, and thresholds are fitted on the training period only.
- Scoring against twelve known stress sessions, with recall always reported next to the flag rate.